

Forest Statistics
Statistics are one way to follow trends within New Hampshire forests. Who owns forestland in the state, how much forestland there is and what the inventory is helps inform decisions about forest management going forward.
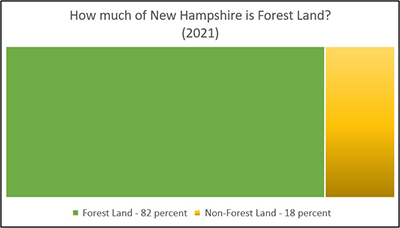
How much of New Hampshire is Forest Land?
New Hampshire remains the second most forested state in the U.S. with nearly 82 percent of the entire state – approximately 4,726,871 acres – categorized as Forest Land.
| Type of Land | Percent |
|---|---|
| Forest Land | 82% |
| Non-Forest Land | 18% |
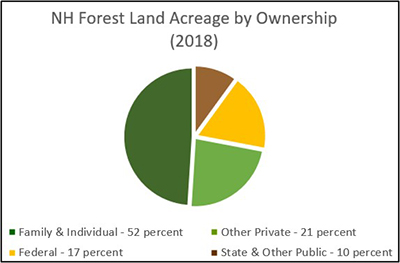
Who owns New Hampshire’s forests?
Almost three-quarters of New Hampshire's forests are privately owned, either by families and individuals or by other private entities, like businesses. The remaining acres are owned by federal, state and other public governments.
Almost three-quarters of New Hampshire's forests are privately owned, either by families and individuals or by other private entities, like businesses. The remaining acres are owned by federal, state and other public governments.
| Category of Owner | Percent |
|---|---|
| Family & Individual | 49% |
| Other Private | 23% |
| Federal | 18% |
| State & Other Public | 10% |
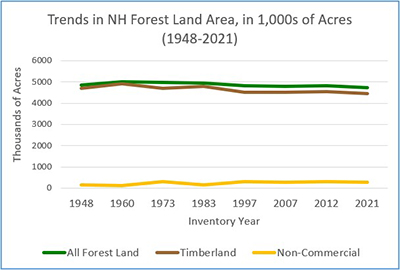
How has forest land use changed in New Hampshire?
Over the past 75 years, the total number of acres of Timberland and Non-commercial/reserved Forest Land in New Hampshire has decreased by 2.5 percent. While the amount of Timberland has decreased by 5 percent over that time, Non-commercial/reserved Forest Land – while a much smaller percentage of the total acreage of Forest Land in the state – has increased almost 70 percent.
| Year | Portion Timberland | Portion Non-commercial/reserved | Total Forest Land – in 1,000s of acres |
|---|---|---|---|
| 1948 | 4,682 | 166 | 4,848 |
| 1960 | 4,907 | 112 | 5,019 |
| 1973 | 4,692 | 293 | 4,985 |
| 1983 | 4,799 | 159 | 4,958 |
| 1997 | 4,509 | 315 | 4,824 |
| 2007 | 4,505 | 285 | 4,790 |
| 2012 | 4,537 | 296 | 4,833 |
| 2021 | 4,445 | 282 | 4,727 |
Notes
- Timberland areas are lands meant to be sustainably managed for natural resource harvesting and are sites that meet the Forest Inventory and Analysis National Program's minimum requirement of being able to produce 20 cubic feet of growing stock per acre annually.
- Non-commercial/Reserved Forest Land has been reserved for non-timber production and may be designated for other uses such as state or federal parks, or as wilderness areas.
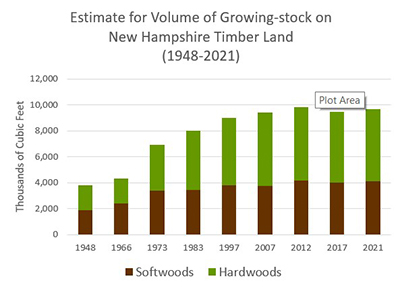
How much wood is available for harvest in New Hampshire forests?
"Growing-stock" is a special category that includes individual trees that meet a state's specifications for commercial products and that are the correct species, size and quality for that purpose. Studying growing-stock trends is important because they not only inform forest products industry professionals who rely on this information as their resource base but they also are one of the oldest metrics used in the Forest Inventory and Analysis National Program.
| Year | Softwoods | Hardwoods |
|---|---|---|
| 1948 | 1,891 | 1,931 |
| 1960 | 2,399 | 1,915 |
| 1973 | 3,398 | 3,514 |
| 1983 | 3,450 | 4,574 |
| 1997 | 3,798 | 5,216 |
| 2007 | 3,758 | 5,682 |
| 2012 | 4,156 | 5,665 |
| 2017 | 4,024 | 5,457 |
| 2021 | 4,097 | 5,569 |
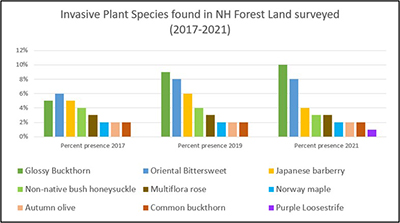
Which invasive plant species can be found in New Hampshire forests?
Also known as non-native plants, invasive plant species – specifically those with aggressive growth habits – can alter the health, structure and overall integrity of existing natural communities by dominating an area and monopolizing available resources such as light, nutrients and water, thereby reducing the ability for native species to grow and thrive.
| Species | Percent presence 2017 | Percent presence 2019 | Percent presence 2021 |
|---|---|---|---|
| Glossy Buckthorn | 5% | 9% | 13% |
| Oriental Bittersweet | 6% | 8% | 9% |
| Japanese barberry | 5% | 6% | 5% |
| Non-native bush honeysuckle | 4% | 4% | 3% |
| Multiflora rose | 3% | 3% | 3% |
| Norway maple | 2% | 2% | 2% |
| Autumn olive | 2% | 2% | 2% |
| Common buckthorn | 2% | 2% | 2% |
| Purple Loosestrife | 0% | 0% | 1% |
Notes:
- In 2017, 111 plots were surveyed. One or more invasive species were found on 13 of those sites.
- In 2019, 93 plots were surveyed. One or more invasive species were found on 17 of those sites.
- In 2021, 95 plots were surveyed. One or more invasive species were found on 40 of those sites.
Most statistics on this page were provided by the Forest Inventory and Analysis National Program and by the Forest Inventory and Analysis New Hampshire Forests 2017 by Randall S. Morin. Another great source of information is the 2020 New Hampshire Forest Action Plan.